Empirical Proof That the Uniparty Does Not Exist
Clear and Striking Differences Between Republican and Democrat Governance
Feel free to republish this piece.
A reason libertarians cite in favor of not voting Republican is that both parties are the same. We are stuck with a “uniparty,” some say.
In “Libertarians Need to Get Real About Politics,” published by Fusion, we said otherwise. We replied to libertarian commenters in “Fear Not Lesser Evil.”
Here we lay out demonstrative empirical evidence that the walks walked by the two parties differ greatly. An establishment of entrenched interests exists; a uniparty does not.
When it comes to libertarian concerns, comparing Democrats and Republicans is not always simple. On some issues, the libertarian position is paradoxical. What if a policy reform—open borders?—is direct-liberty augmenting but overall-liberty reducing?
Our implied reader is a libertarian—not because we equate libertarianism with the good but because we plead with libertarians.
Congresspeople
For ratings of Congresspeople, we recommend the following three sources:
Americans for Prosperity Scorecard
The Heritage Foundation Scorecard
(We thank Eric Hammer for data work and displays shown in this section of the essay.)
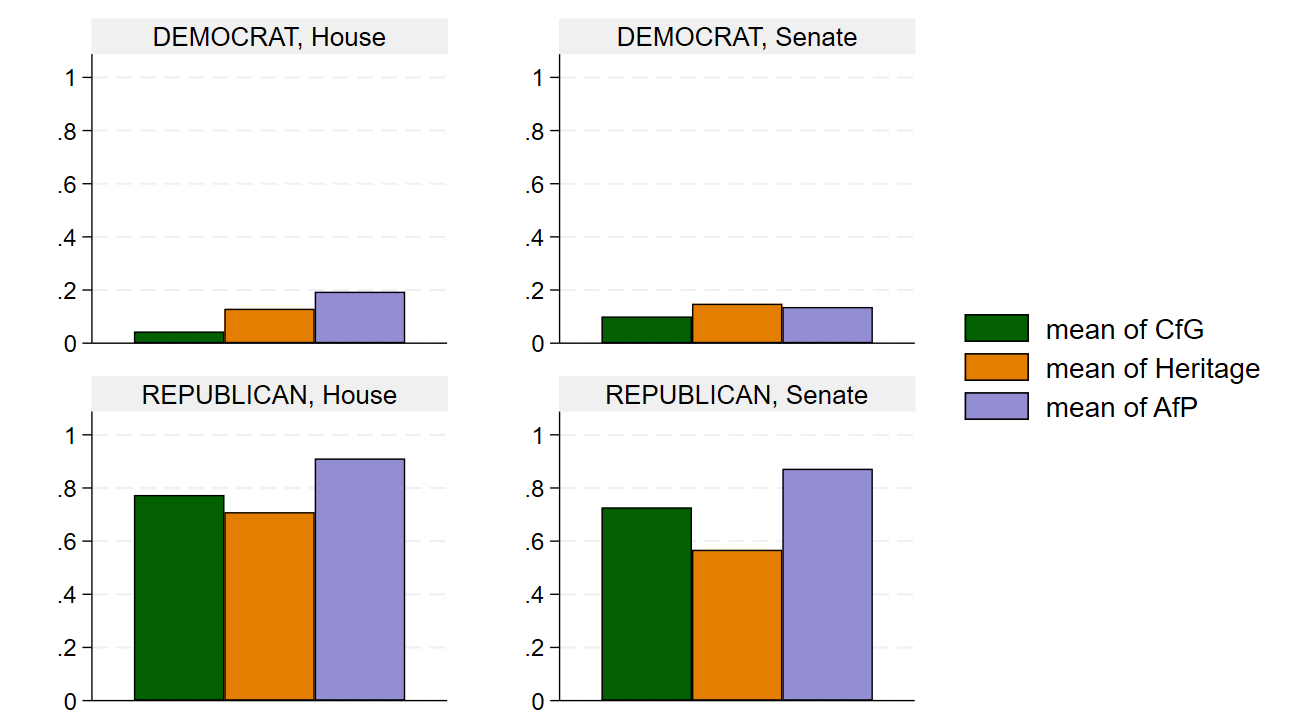
All three scorecards show a large and systematic difference between Republicans and Democrats. The vertical axis shows the score, and the colored bars are averages:
The Republican average scores are not merely better. They are vastly better!
Americans for Prosperity (AFP) for 2023: If you click on the link above and load ALL members of Congress, from both Houses, you can scroll through the enormous listing. Here are the distributions of AFP scores by party and by chamber:
AFP notes that the scores “are based solely on bills to which AFP has assigned key vote alerts.” We have not studied the bill selection. The mission of AFP is to promote deregulation and fiscal conservatism.
The Club for Growth: Its mission is similar and its results are similar:
Are Democrats and Republicans mirror images of one another?
Far from it!
The Heritage Foundation: Its scorecard surveys a broader range of bills, and there might be more libertarian disagreement than with either of the prior two scoring criteria.
In Heritage’s scorecard, spreads for Republicans, especially in the Senate, are greater than with the other two scorecards, reflecting perhaps the broader range of legislation. Still, a huge difference between Republicans and Democrats is evident.
The three scorecards all show large and systematic differences between Republicans and Democrats.
Around the 50 States
Next we examine state-level comparative scorecards based on which party has control of government—Republican trifecta, Democratic trifecta, or mixed government.
Some trifectas are only very recent while others trifectas have held for 30+ years. Still, we lump together all current trifectas.
As of 2024 there were 23 Republican trifectas, 17 Democratic trifectas, and 10 states with divided governments (the lowest in decades, notes Ballotpedia).
Personal Freedom
The Cato Freedom in the 50 States report is divided into personal and economic freedom. The personal freedom category factors are shown in the following figure:
The Personal Freedom portion of Freedom in the 50 States accounts for 33.8% of a state’s total freedom score; the percentages shown above for each of the twelve factors are of the full freedom score’s 100%.
One might question giving cannabis and salvia freedom nearly the same weight as educational freedom, and giving gambling freedom more than either. But so be it.
Cato finds that Democratic states score better in personal freedom. Twelve of 17 Democratic controlled states are in the top half, compared to only eight of 23 Republican states. While Republican states make up four of the top ten, they also comprise eight of the bottom ten.
Economic Freedom
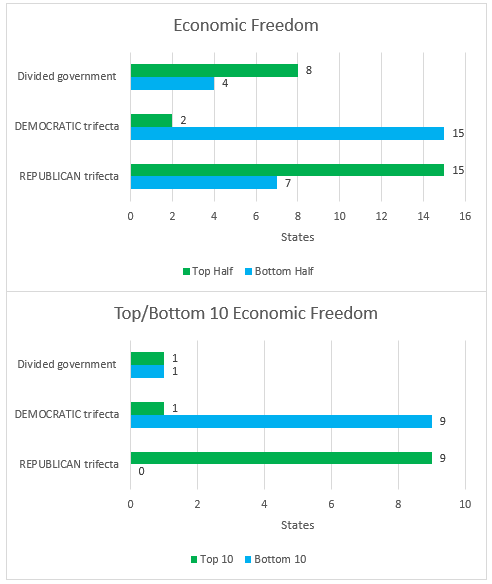
In contrast to personal freedom, the economic side of the Cato Freedom in the 50 States report is dominated by Republican states. The report is scored based on both fiscal freedom (which is based on taxation and various other aspects of state finances) and regulatory freedom (which is scored off of factors such as land use regulations, labor markets, occupational licensing, and health insurance).
Only two Democratic controlled states make it into the top half at all, in contrast to 15 Republican states. Nine of the bottom 10 states are Democratic controlled, with no Republican states in the bottom 10 at all.
Cato combines the personal and economic freedom scores to make an overall freedom index by state, and the overall results generally rank Republican states above Democrat states. Indeed, the six lowest ranked states are Maryland, Oregon, New Jersey, California, Hawaii, and, in last place, New York.
Educational Freedom
Perhaps one of the most clear cut cases of Republicans unequivocally carrying the field is when it comes to school choice. The finding of a 2021 AEI report is remarkable. On the state level “Among 70 votes held on final passage for private school choice legislation, Democrats provided only 381 ‘yes’ votes compared to 2,844 Republican ‘yes’ votes,” and “There were only three votes out of 70 in which Republicans needed any Democratic votes to reach a 50 percent threshold in a state house or senate.” On legislation that would enhance school choice, the ratio of supporters was 7.46 Republicans to 1 Democrat (7.46 = 2844/381). States where such votes are taken are, on the whole, surely somewhat disproportionately Republican, but still the 7.46 ratio is striking.
Looking at Heritage Action’s Education Freedom Report Card, we see the results of this voting behavior. Nineteen out of 22 Republican trifecta states are in the top half of the report, whereas every single Democratic trifecta state is in the bottom half.
Religious Liberty
The Center for Religion, Culture, and Democracy’s 2023 Religious Liberty in the States project finds that both parties tend more to favor religious liberty than not, though not by particularly large margins.
Occupational Licensing
The Archbridge Institute publishes a state occupational licensing index. This report measures barriers to entry and the total number of licenses that each state requires. Looking at top and bottom halves, Republican trifecta states do only slightly better than Democratic trifecta states.
When looking at the top/bottom 10, however, we see 5 Republican states in the top and four in the bottom, compared to the Democrats two in the top and three in the bottom. So Republicans have a small edge when it comes to occupational licensing.
Cato’s Fiscal Policy Report Card on America’s Governors 2024
Cato’s Fiscal Policy Report Card on America’s Governors 2024 is clear and striking in its findings. Democratic governors are by and large terrible at managing their state’s finances. All of the A grades went to Republicans, all of the Fs and nine out of ten Ds went to Democrats. This year Republican governors had an average score of 56 and the Democrats 42. The governor who came in dead last was Tim Walz of Minnesota.
Covid Lockdowns
An example of increasing lawlessness among the left is the era of covid restrictions and the blatant double standards that came with them. Many people have been eager to forget the chaos and disruption unleashed by draconian lockdowns. But the lockdowns and other measures were a tremendous assault on our traditional rights and liberties.
William S. Stickman, a district judge of the United States District Court for the Western District of Pennsylvania, put things very plainly in his September 2020 ruling against Democratic Pennsylvania Governor Tom Wolfe’s lockdown orders.
The fact is that the lockdowns imposed across the United States in early 2020 in response to the COVID-19 pandemic are unprecedented in the history of our Commonwealth and our Country. They have never been used in response to any other disease in our history. They were not recommendations made by the CDC. They were unheard of by the people [of] this nation until just this year. It appears as though the imposition of lockdowns in Wuhan and other areas of China--a nation unconstrained by concern for civil liberties and constitutional norms--started a domino effect where one country, and state, after another imposed draconian and hitherto untried measures on their citizens. The lockdowns are, therefore, truly unprecedented from a legal perspective…
The Court declares, therefore, that the stay-at-home components of the Defendants' orders were and are unconstitutional. Broad population-wide lockdowns are such a dramatic inversion of the concept of liberty in a free society as to be nearly presumptively unconstitutional unless the government can truly demonstrate that they burden no more liberty than is reasonably necessary to achieve an important government end. The draconian nature of a lockdown may render this a high bar, indeed.
(A stay was issued against his ruling and the Republican controlled legislature was forced to amend the state constitution via a referendum to curb the governor’s endless emergency powers.)
It is not necessary to rehash here the extreme and ongoing harms of the lockdowns, ranging from economic devastation, extreme price inflation, increased substance abuse, increased domestic abuse, childhood development impairments, increased suicide attempts, not to mention their denial of our fundamental social and spiritual nature as human beings.
This carnage was not brought about solely by Democrats. Mike DeWine, the Republican governor of Ohio, initiated sweeping lockdowns early in the pandemic. Republican President Trump deserves criticism for lacking a robust defense of freedom and for his failure to jettison Anthony Fauci and others who played no small role in the catastrophe.
However, by and large, lockdowns rapidly became another polarized issue where Democrats lined up on the side of lockdowns and mandates and Republicans on ending restrictions and trying to return to normalcy. Republican governors, like Brian Kemp (GA), Kristy Noem (SD), and Ron DeSantis (FL) became the standard bearers against the unprecedented government control of daily American life, while Gavin Newsome (CA) represented Democratic extremism. Meanwhile, Joe Biden crowed about “a winter of severe illness and death” in 2021 and his administration fired 8,400 military service personnel over their refusal to get the Covid vaccine, though by the end of 2023 the Federal Government was reduced to begging such troops to return in the wake of widespread recruiting shortfalls.
Both parties deserve blame, but in hindsight it is clear that within a few short months Democrats became the party of lockdowns and Republicans the party of defending basic freedoms.
The point is driven home by lockdown data. In May of 2021 the Blavatnik School of Government at Oxford University released its third and final edition of its report “Variation in US States’ COVID-19 Policy Responses.” The report examined the stringency of state government responses to the disease, looking at things such as school and workplace closings, stay at home orders, and travel restrictions. The paper includes an ordinal listing of states based on the amount of times the state spent above a stringency index of 60.
We plugged that ordinal ranking into our listing of state trifectas to find the following result:
The results are even more striking looking at the top and bottom 10.
ALEC Rich States, Poor States Economic Performance
The American Legislative Exchange Council (ALEC) publishes the Rich States, Poor States report. The 2023 report is divided into two scores, economic performance and economic outlook. The economic performance score is based on state gross domestic product, absolute domestic migration, and non-farm payroll employment over a 10-year period.
When it comes to economic performance, 15 of the top 25 states are governed by Republican trifectas, while seven are governed by Democrats. Thus, 65 percent of Republican governed states are in the top half, compared to only 41 percent of Democratic states.
When it comes to the top ten states, six are Republican trifectas while two are Democrat controlled. In contrast, two of the bottom 10 states are Republican controlled, while four are Democrat controlled.
Economic Outlook
ALEC’s Rich States, Poor States measures economic outlook based on 15 different variables, including tax burdens, state fiscal health, whether the state is right to work, and other factors.
Seventeen of the top 25 states are Republican controlled (73 percent of Republican controlled states), with only two Democratic controlled states being in the top half (11 percent of Democratic controlled states). Only five Republican controlled states are in the bottom half, while there are 15 Democratic controlled states.
When it comes to the top and bottom 10 states, there is a clear divide . Seven of the 10 top states are Republican controlled; zero Democratic states are in the top 10. Nine of the bottom 10 states are Democratic controlled and no Republican controlled states are in the bottom 10.
Supplemental Poverty Rate
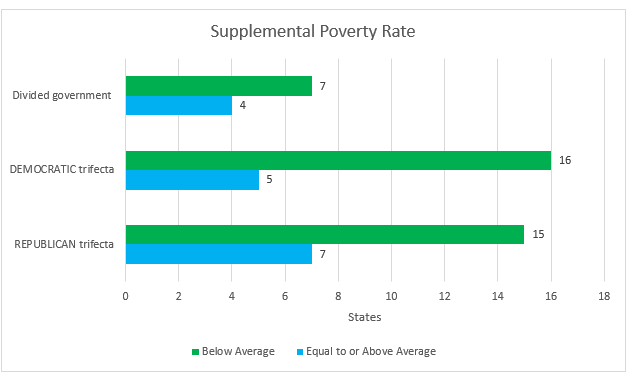
The Supplemental Poverty Measure (SPM) is published by the Census Bureau as a more sensitive measure of poverty in the US that reflects geographic differences and taxes. Sixteen Democrat controlled states are below the average state poverty rate with five above, in contrast to 15 and seven, respectively, in Republican controlled states.
However, four of the five democratic controlled states with a SPM equal to or above average are in the bottom 10, and in fact New York and California have the highest SPM poverty measure, with California having a rate of 13.2 percent, 1.3 percentage points higher than the highest Republican controlled state, Mississippi.
Blue Counties vs Red Counties Murder Rates
There is a stark contrast between Democrat and Republican states when it comes to crime. A Newsweek headline from 2023 declared “Crime is Making Americans Flee Democratic States.” According to the report the top four reasons people were making the move were “politics, the cost of living, taxation—and crime.”
Comparative crime statistics are a matter of contention. A much-debated report from the leftist think tank Third Way stated, “The murder rate in the 25 states that voted for Donald Trump has exceeded the murder rate in the 25 states that voted for Joe Biden in every year from 2000 to 2020.”
However, as many critics have pointed out, law enforcement is not a unitary function of the state government, but rather is divided among state, county, and local municipal police. When crime data is disaggregated from the state to the county level, the data tells a different story.
The Heritage Foundation compared the numbers between a state by state analysis and a county-by-county analysis to find that the situation is the opposite of what Third Way was implying.
The Heritage analysts also pointed out that the Third Way methodology was flawed in that it compared murder rates going back 20 years on the basis of which candidate a state voted for in the 2020 election. Several states have not remained electorally constant over the past two decades. Heritage amended the methodology to reflect this and found that yet again red states had a higher murder rate, but that in reality on a county-by-county basis blue counties have far exceeded the national homicide rate, whereas red counties were far below it.
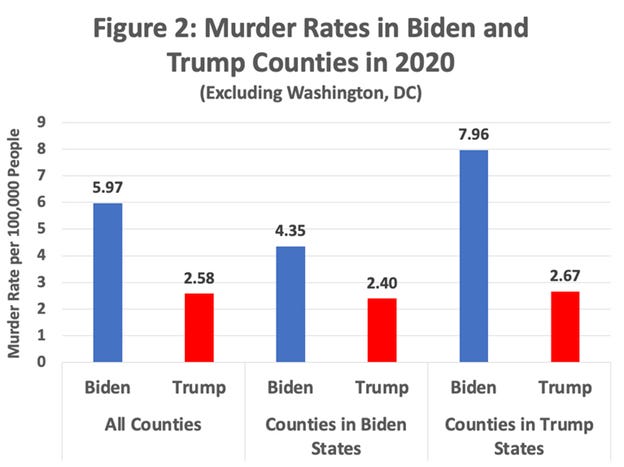
In response to similar Democrat claims about homicide rates in red states, The Crime Prevention Research Center researched the numbers on a county basis, with the added metric of differentiating counties in Biden states and counties in Trump states. According to their data, the murder rate in Biden counties in Trump states exceeded the murder rate in Biden counties in Biden states. The murder rate in Trump counties in all scenarios was less than the rate in Biden counties.
Retail Theft Leading to Store Closures
Libertarians often favor decriminalization, but do they want theft to be decriminalized?
California Proposition 47, passed in 2014, classified any theft with a value less than $950 as being a misdemeanor rather than a felony. This has led to open season for shoplifters around the state.
Perhaps you have seen videos of brazen looting. One might argue that such incidents are shocking, but rare. The proof is in the pudding when it comes to the mass exodus of retailers from theft-ridden areas.
CVS is closing 900 stores across the country, in part from losses from astounding levels of retail theft, such as a CVS in Washington DC that has closed due to the repeated ransacking of the store, where thieves would pillage merchandise on delivery days before it had even made it to the shelves. In October 2023 Target stated that it was closing nine stores around the country because of rampant theft.
Some stores place all of their products behind locked doors that require a staff member to unlock. As The Economic Times puts it, “In response to this alarming situation, some stores have resorted to drastic measures, locking up everyday items like toothpaste, deodorant, and tissues behind transparent doors.”
Such stories are emblematic of the larger scale picture of what has happened in urban areas across America. In the words of David Johnston of the National Retail Federation (NRC):
Retailers are seeing unprecedented levels of theft coupled with rampant crime in their stores, and the situation is only becoming more dire. Far beyond the financial impact of these crimes, the violence and concerns over safety continue to be the priority for all retailers, regardless of size or category.
Flash mobs engage in blatant theft. Many are part of organized retail crime that steals from retailers and then sells the merchandise online or sometimes on the street, even in front of the very store it was pilfered from. According to the National Retail Federation, 78.1 percent of stores report that organized retail crime is more of a priority in 2023 compared to 2022, which is remarkable given that in 2022 70.7 percent reported that it was a higher concern compared to five years ago.
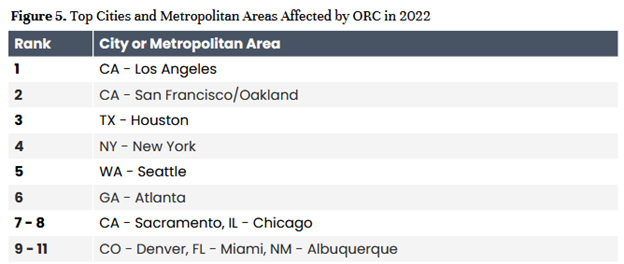
The NRC lists the top ten cities affected by organized retail crime (ORC). All are deep blue strongholds, with the sole exception of Miami Florida (which has been trending red the past few years), which was tied for 9th, 10th, and 11th place.
The NRC notes that “72% of respondents reported an increase in average value per incident in areas that increased felony thresholds. Initiatives to reduce or eliminate cash bail also make an impact; 67% reported an increase in repeat offenders in these areas.”
Eliminating cash bail and increasing the threshold for felony theft are Democratic hobby horses that have been causes célèbres among leftist district attorneys and others.
Readers may recall the rampant looting of train cars in Los Angeles in the beginning of 2022. Shocking videos show looters casually cutting the locks on cargo cars and pilfering packages at will, leaving behind an immense heap of garbage in their wake. CNN reported at the time that the Union Pacific Railroad
says it may avoid operating in Los Angeles County following the spike in thefts, which it blames on lax prosecution of crimes… Union Pacific said last month in a letter to the Los Angeles District Attorney that it saw a 160% year-over-year increase in theft in LA county. The company claims that a December 2020 special directive issued by District Attorney George Gascón that changed how low-level offenses are prosecuted has contributed to the uptick.
These theft rings were eventually broken up, but only after videos of the blatant theft in broad daylight led to national outrage. This is seemingly in keeping with Governor Gavin Newsom’s openly acknowledged philosophy that problems should only be addressed when they become embarrassing in front of visiting Chinese dignitaries, not because they are problems.
Questionable Crime Statistics
For the past few years there has been an extreme disconnect between the public, which polling routinely indicates view crime as increasing, and official government statistics, which leftist pundits point to to argue violent crime has actually decreased.
Detractors of the figures have pointed to the fact that in the most recent crime reporting data to the FBI in 2022, a full 31 percent of law enforcement agencies did not report anything at all. This includes The New York City Police Department, the Los Angeles Police Department, and the San Francisco Police Department.
However, the FBI has quietly revised its violent crime statistics for 2022 by an astounding 6.6 percentage points. Whereas previously it had reported the violent crime rate as having dropped by 2.1 percent, its new revised numbers, which it did not note in its press release, now found that violent crime had increased by 4.5 percent. Carl Moody, a professor at The College of William and Mary, noted to RealClearInvestigations that there were zero revisions to the violent crime numbers between 2004 to 2015, and that the changes from 2016 to 2020 were less than one percent. Happy crime stats need scrutiny.
Inter-State Migration: Demonstrated Preference
Libertarians note that few Americans try to get into Russia, China, Cuba, or North Korea, while millions are eager to get into the United States. Voting with one’s feet is an example of demonstrated preference. Patterns of internal migration reveal a great deal about the walk people walk rather than the talk they talk.
Let’s start with the seven states that lost a seat in the House of Representatives as a result of the 2020 census. AEI’s Mark Perry broke down the seven losers and six winners “on 11 different measures of economic performance, labor market dynamism, business climate, electricity and housing costs, tax climate, and fiscal stability for those 13 states.” As his charts make clear, the growing states, Texas and others listed here, outperformed the loser states on every metric.
Meanwhile, the losing states include California, Illinois, and New York:
Four of the loser states, Ohio, Michigan, West Virginia, and Pennsylvania, are part of the rust belt, which has been losing population in general for decades, but even then it is obvious that policy decisions have contributed to the bleeding. For example, Pennsylvania’s top corporate tax rate of 9.99% exceeds that of California.
Perry analyzed the same measures from separate data from the Census Bureau looking at net domestic migration between April 1, 2020 and July 1, 2021. On every metric, the growing states dominated the losers.
Perry included the state’s legislative majority party in 2021 and governor’s party. The results: 9/10 of the legislatures and 8/10 of the governors in the top ten states were Republican. In contrast, 7/10 of the legislatures and 8/10 of the governors in the loser states were Democrat.
County by County
We can approach things at a more granular level. In April of 2023, Issues and Insights crunched the internal migration numbers from the Census Bureau for mid-2020 to mid-2022 on a county level overlaid with which way each county voted in the 2020 election. The results are striking.
They found that in that two-year period there was a net internal migration of 2,562,937 people from Biden counties to Trump counties. A full 61 percent of Biden counties lost population, compared to 65 percent of Trump counties gaining population.
Even in states that suffered massive population loss, Trump-supporting counties still managed to gain population, highlighting that Trump counties in California had a net gain of 8,412, New Jersey a net gain of 22,507, and Michigan a net gain of 28,091.
In contrast, Biden counties in states that saw massive population growth saw net population decline. Biden counties had net losses of 3,374 in Florida, 28,178 in Georgia, and 37,306 in Tennessee.
Concluding Remarks
Democrat elites are now systematically betraying the classical liberal arc of the past 500 years. A centerpiece of that arc is the American political system established in the late 18th century. Civic virtue stands with that arc and with that centerpiece. Civic virtue stands against systematic betrayers. Thus, today, Republicans are the lesser evil.


